
Jeff Long, you can find him in Discord, and I have tracked along with Peter Reznicek for many years dating back to the heydays of Thinkorswim. While I do not necessarily follow along with Peter on a daily basis, I am a member and maintain a subscription to his ShadowTrader website. I think quite a lot of Peter and the manner in which he interprets the market. I believe Peter continues to utilize his “Quad” setup for market internals. Jeff and I have noodled around with this for years and have expanded the four sections to eight which we have so dubbed, The Oct.
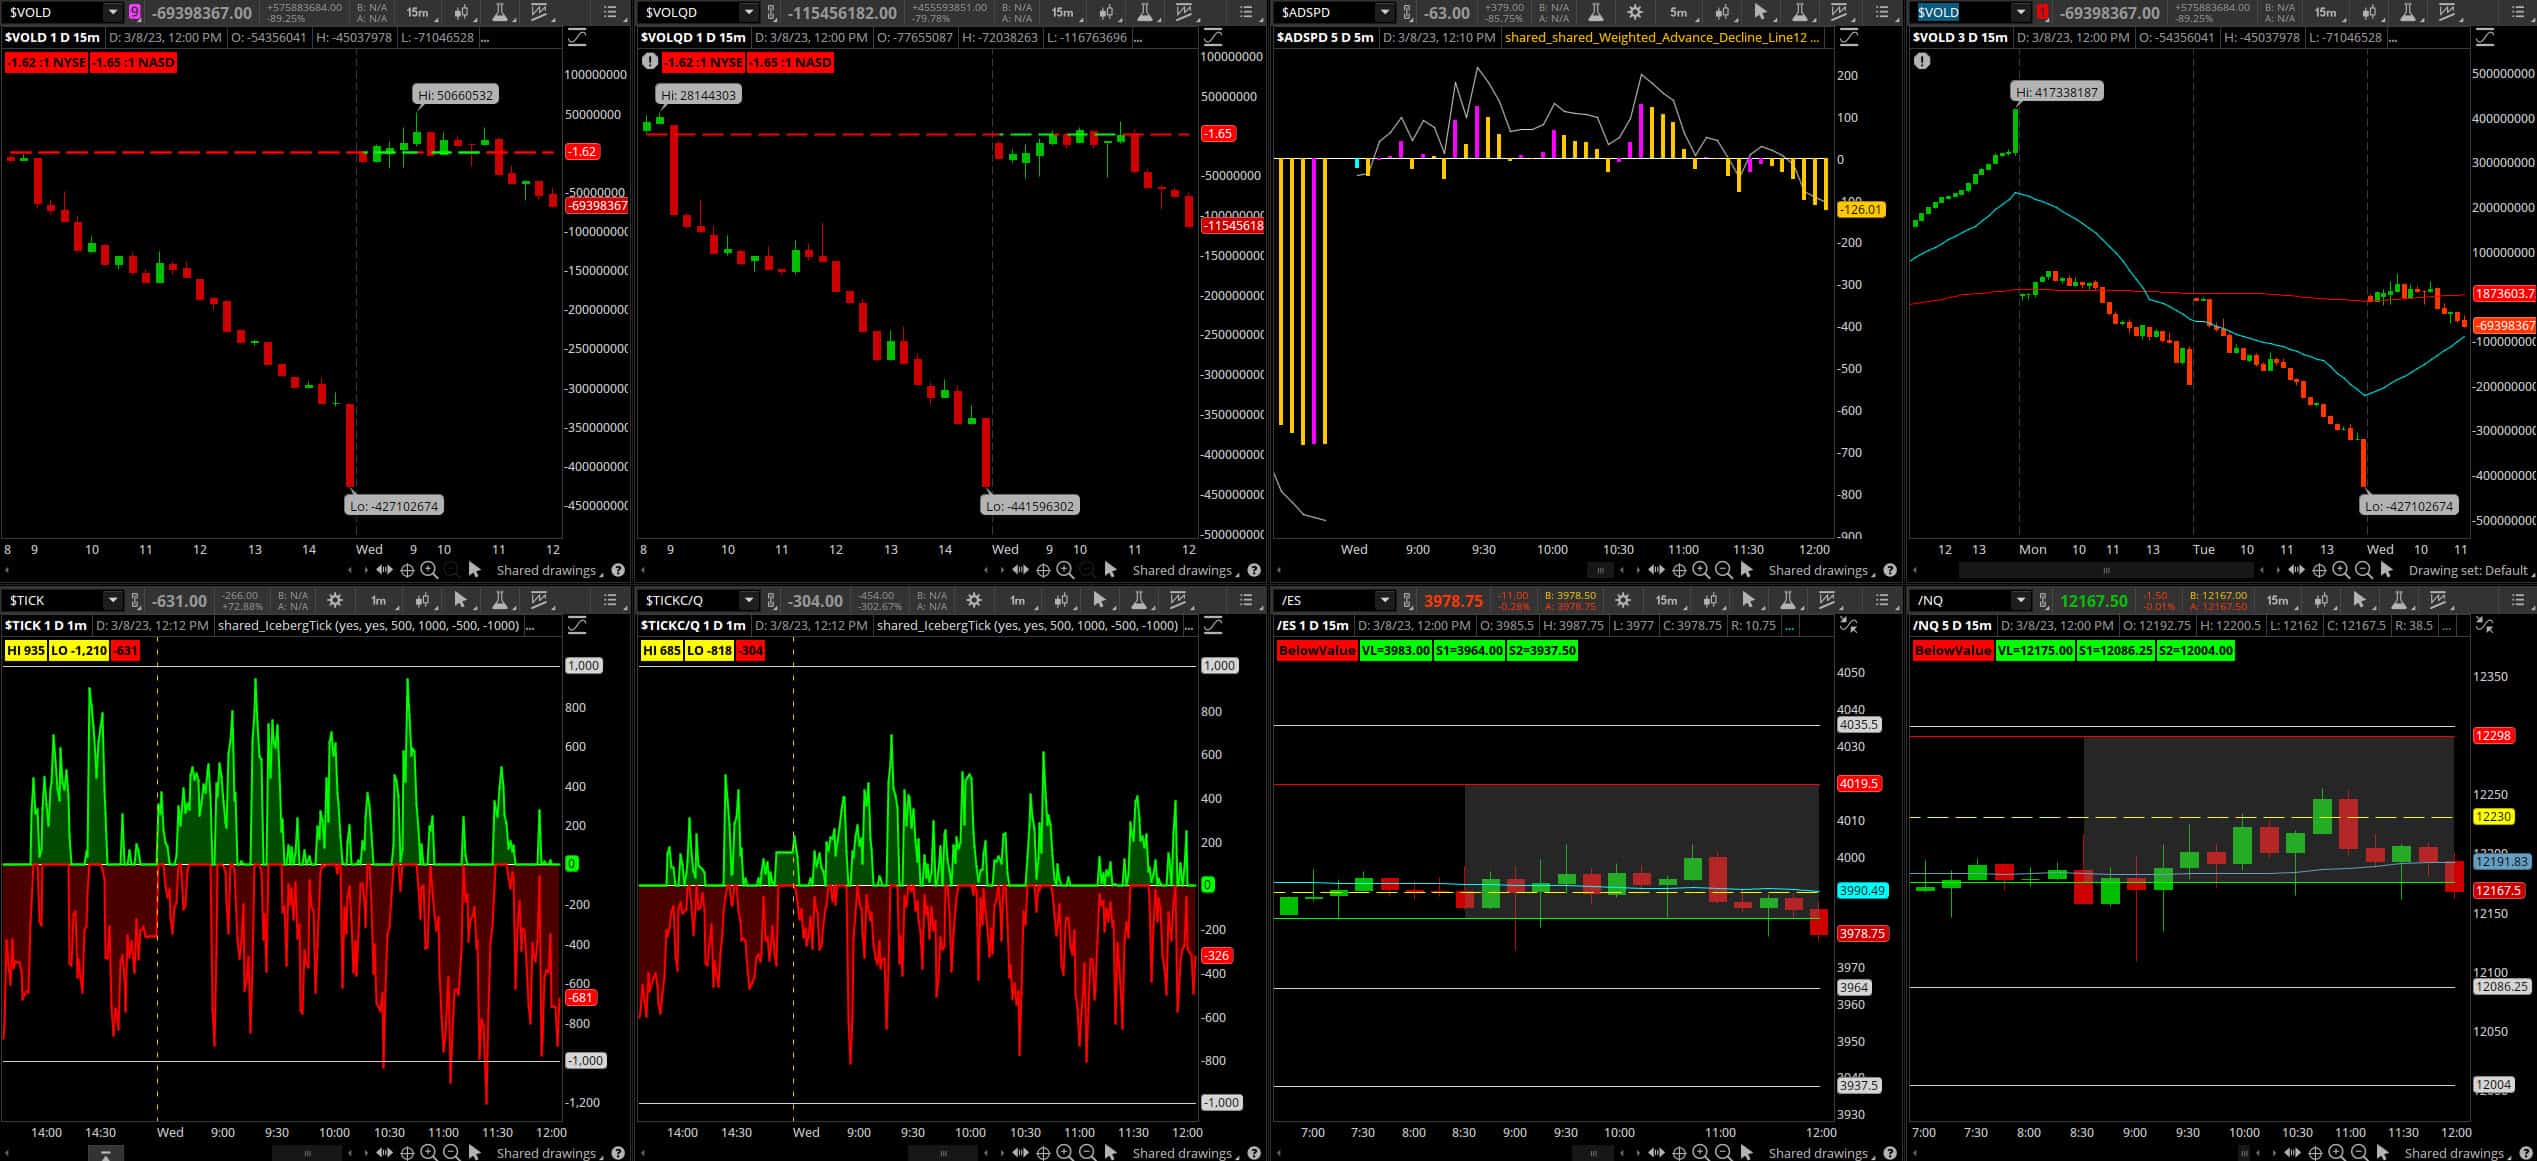
First thing to do is set the top/left chart to $VOLD (15 minute). Next, set the chart to the right of that one to $VOLQD (15 minute).
Now that you are able to see the NYSE and Nasdaq Up/Down volume, let’s add Breadth Ratio Bubbles to each of those charts. You can download the Breadth Ratio Bubbles Thinkscript (for Thinkorswim) from the ShadowTrader website: https://www.shadowtrader.net/product/breadth-ratio-bubbles/
Once downloaded, follow along with Peter to install and configure:
Next up is the third chart from the top/left, we will install the Weighted S&P Advance Decline Line Thinkscript. You can purchase this script from ShadowTrader: https://www.shadowtrader.net/weighted-ad-line-thinkscript/
Here is a video Peter made about the Weighted Advance Decline Line script:
Note the Weighted A/D Line Indicator should be updated with new Sector Weight data points each month. The data is free from S&P Global. The data is generally updated on the last day of each month.
Fourth up is the chart on the top/right; I set that one (presently) to Link Chart #1 (15 minute) so it shows whatever product is currently on my main page. I have an idea for what I would prefer in that area, but I do not have it dialed in just yet.
On to the bottom four charts. Beginning at the bottom/left, you can use either the Iceberg Tick as I have it, or the free version Tick Values and Distribution
For the free version, follow along with Peter to install (note this video is older and the ShadowTrader website has changed). To obtain the code, visit the page link and add to cart. Go on to the next section for the Iceberg version.
If you choose to use the Iceberg Tick, you can purchase it here: ShadowTrader Iceberg Tick Thinkscript
Note that if you are cruising the ShadowTrader site and come upon the Cumulative Tick script, it was the precursor to the Iceberg Tick. While I did use the Cumulative Tick for a while, I switched to the Iceberg when it became available. I mention it because as a new visitor to the site, one might not immediately recognize the progression.
The follow along with Peter to customize and interpret the script:
The final two charts are easy-peasy, simply set them to a 15 minute timeframe and toss up the /ES on one and the /NQ on the far right. Next, install the Value Areas & Pivots Thinkscript
Follow along with Peter: How to Install Value Area & Pivots Thinkscript on your Thinkorswim platform.
Note that to properly use Value Areas & Pivot Points, there are four data points that must be inputted, in each of the two charts, each morning. Those values are available to subscribers of Peter’s Pre-Market Perspective ($20 per month) or you may be able to find them online for free.
You are all set!
Be sure to save your Oct setup!